On This Page
PRISM | PORTFOLIO RISK INTELLIGENCE AND STRATEGY MANAGEMENT
Portfolio Optimization
Optimize your portfolio using advanced investment management strategies to maximize returns and minimize risk. Choose from various models, including maximizing Sharpe Ratio and minimizing volatility.
Application Overview
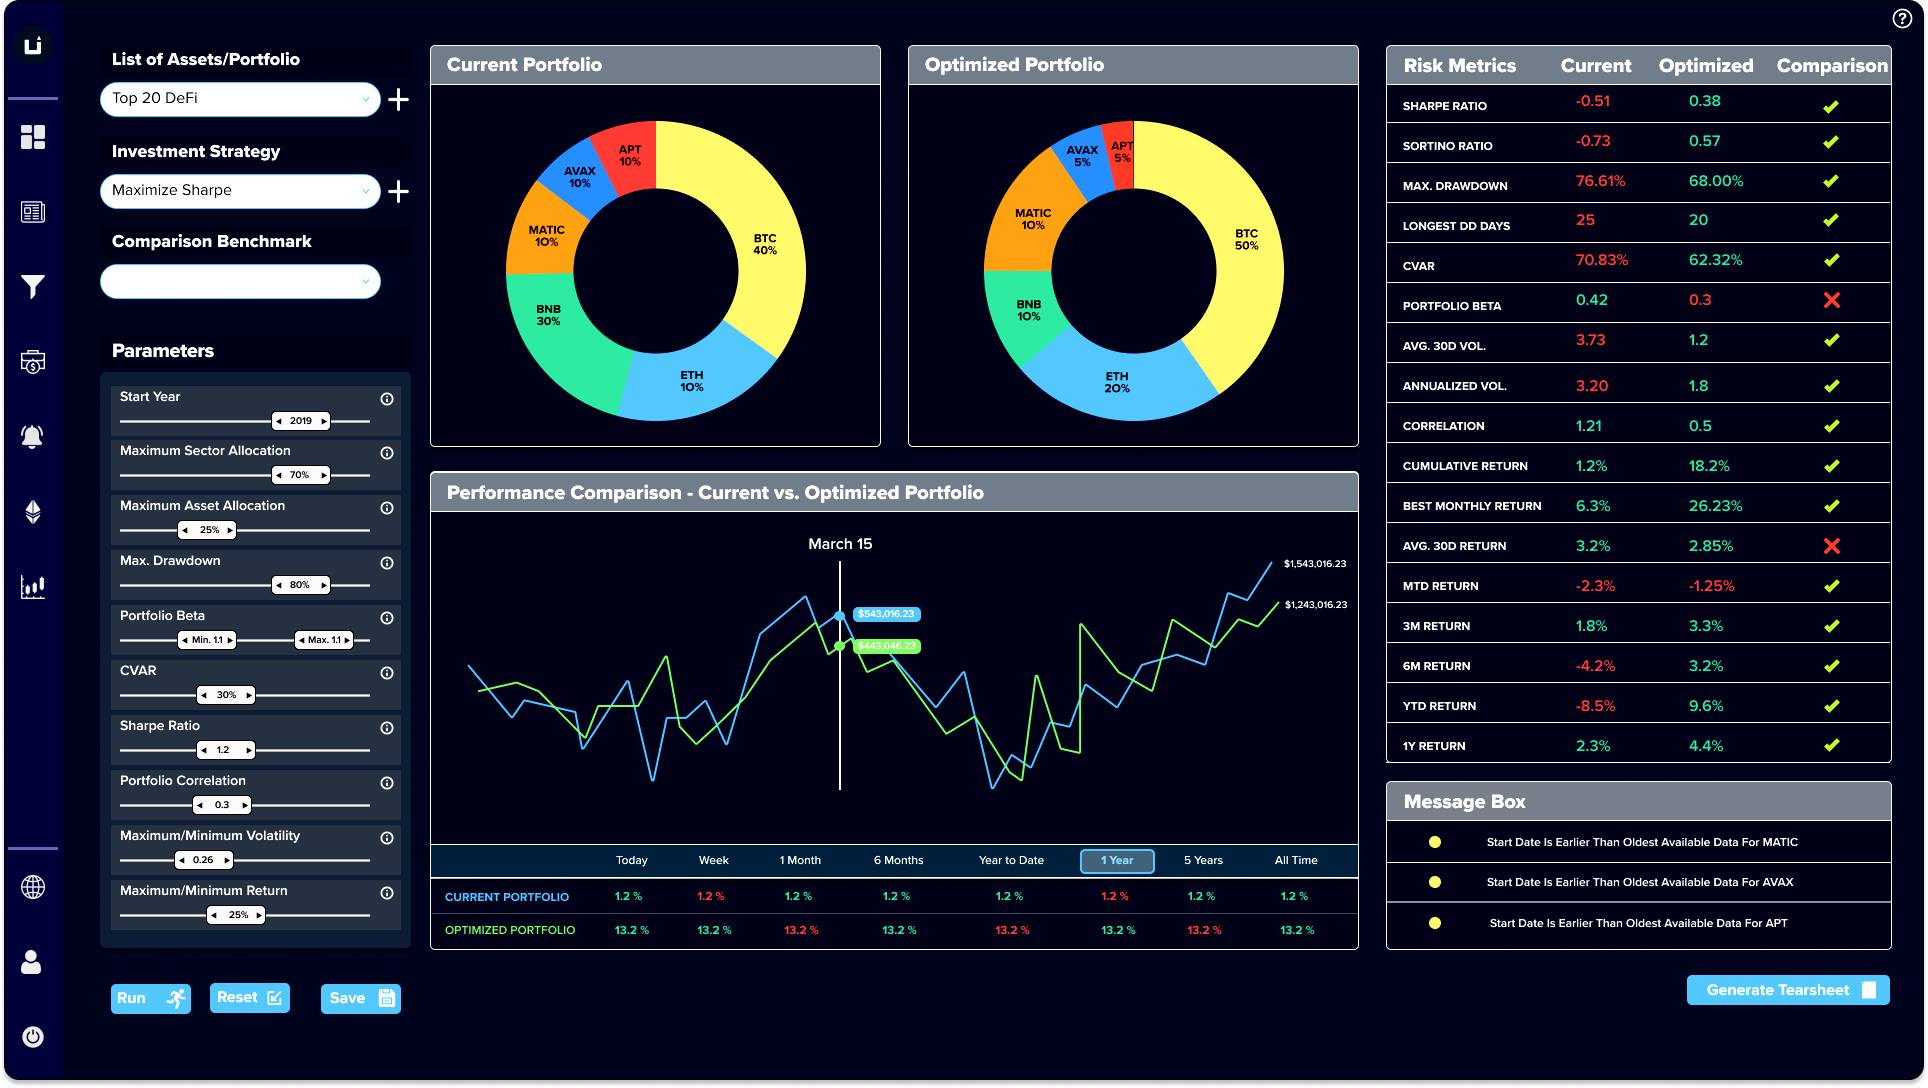
PRISM's Portfolio Optimization application empowers users to create or optimize portfolios based on different investment management strategies. By leveraging Uptick's proprietary optimization models, users can measure portfolio risk and make informed adjustments to align their portfolios with their risk and return objectives. The user-friendly interface simplifies the optimization process, enabling users to explore various strategies and make data-driven decisions.
Application Features
| Strategy Selector
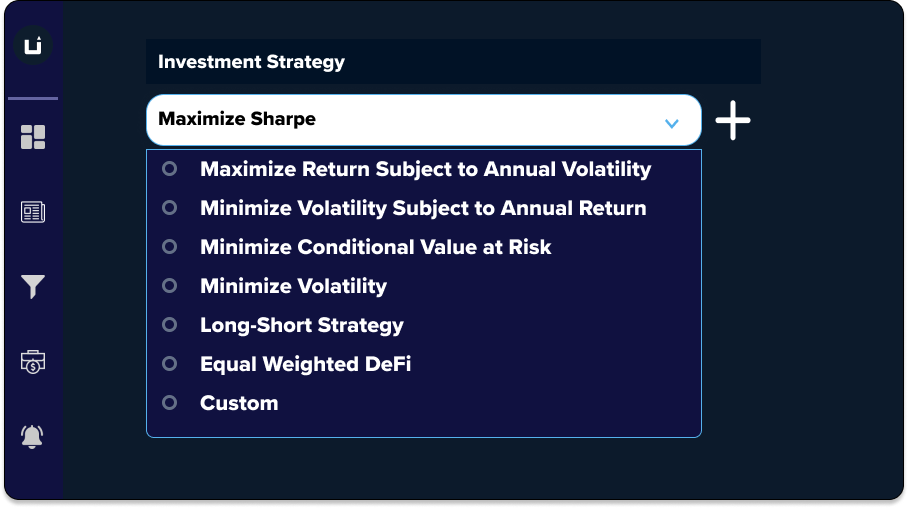
Choose from a range of optimization strategies, such as Maximize Sharpe Ratio, Maximize Return Subject to Annual Volatility, Minimize Volatility Subject to Annual Return, Minimize Conditional Value at Risk, or Minimize Volatility. This flexibility allows users to select a strategy that best aligns with their investment goals and risk tolerance.
| Customizable Parameters
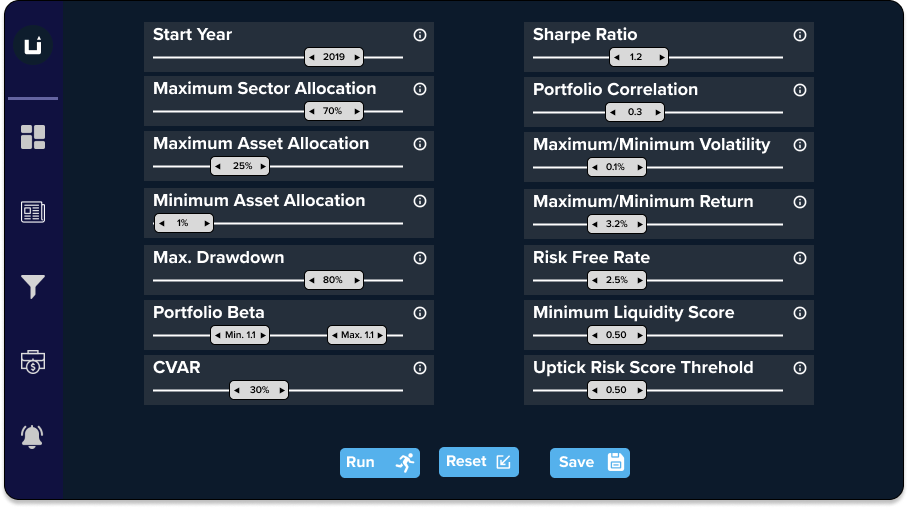
Tailor the optimization process by setting specific parameters, such as sector and asset allocation, CVaR, Sharpe, volatility, beta, and liquidity score. These customizable parameters ensure that the optimized portfolio meets the user's unique investment criteria.
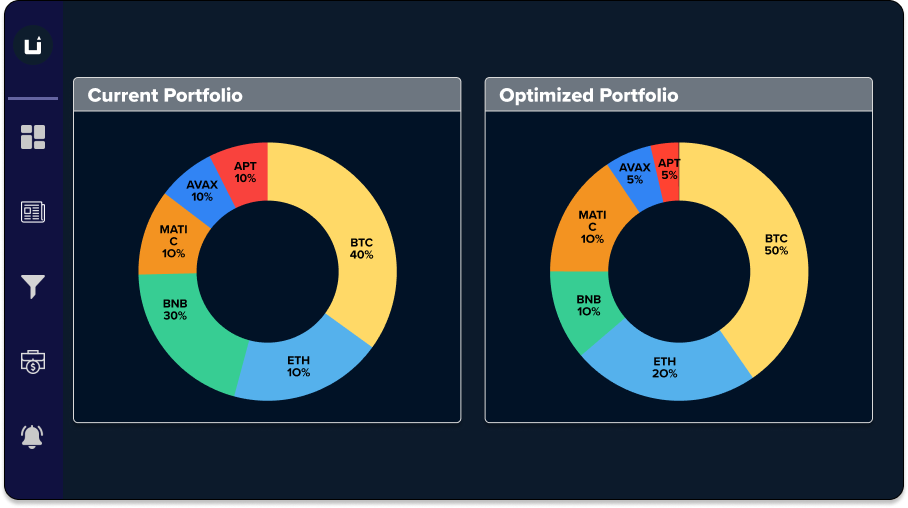
| Visual Comparison
The center panel displays two pie charts that enable users to visually compare their current asset allocation with the optimized allocation. This clear presentation of data helps users understand the impact of the optimization process on their portfolio composition.
| Comprehensive Risk Metrics
The right panel displays key portfolio risk metrics, allowing users to evaluate the optimized portfolio's risk-adjusted performance. By understanding the risk characteristics of their optimized portfolio, users can make more informed decisions about portfolio adjustments.
| Real-time data
Access live market data, including prices, volumes, and market capitalizations, to stay ahead in the rapidly evolving financial asset landscape.
| Customizable views
Personalize the dashboard to focus on the assets and data points that are most relevant to your investment strategies and goals.
Parameters for Portfolio Construction and Optimization
| Parameter Name | Value Range | Description/Usage |
|---|---|---|
| Start Year | 2015 - 2023 | Start year for data selection for evaluation of an investment strategy |
| Maximum Sector Allocation | 0% - 100% | Users can create a diversified portfolio using the sector selector. Each currency is classified into a unique sector from nine sectors. |
| Maximum Asset Allocation | 0% - 100% | The maximum allocation or threshold percentage for any asset in the portfolio. |
| Minimum Asset Allocation | 0% - 100% | The minimum exposure users want to have to an asset. |
| Maximum Drawdown | 0% - 100% | Acceptable drawdown value during portfolio creation process. |
| Portfolio Beta | 0 - 2 (or higher) | Measure of portfolio sensitivity to market changes. |
| Sharpe Ratio | 0 - 5 (or higher) | Measure of risk-adjusted return. |
| CVaR | 0% - 100% | Conditional Value at Risk quantifies tail risk of a portfolio. |
| Portfolio Correlation | 0(or lower) - 1(or higher) | Correlation coefficient of assets in the portfolio. |
| Maximum/Minimum Volatility | 0% - 10%(or higher) | Modulate portfolio volatility by setting thresholds. |
| Maximum/Minimum Return | 0% - 100%(or higher) | Investment returns threshold for the portfolio. |
| Risk-Free Rate | 0% - 100% | Modulate portfolio during uncertain monetary policy times. |
| Minimum Liquidity Score | 0 - 100 | Aggregated index of cryptocurrency liquidity across exchanges. |
| Uptick Risk Score Threshold | 0 - 1 | Metric gauging riskiness based on developer activity, sentiment, market cap, etc. |
| Enable Shorting | TRUE/FALSE | Create long-short strategy with precise allocations. |
Portfolio and Risk Managers can monitor the impact of parameter tuning on the risk metrics during the portfolio creation and optimization process.
Usage Examples
A risk manager at a financial asset hedge fund is looking to reduce the overall risk of their portfolio while maintaining the same level of return. They use PRISM's Portfolio Optimization application to select the "Minimize Volatility Subject to Annual Return" strategy, inputting their current portfolio return as the target. After reviewing the optimized asset allocation and risk metrics, the risk manager decides to rebalance the portfolio to achieve the desired risk profile.
A financial advisor working with a high-net-worth client is seeking to diversify their client's portfolio by investing in financial assets. The advisor uses PRISM's Portfolio Optimization application to select the "Maximize Sharpe Ratio" strategy, aiming to maximize risk-adjusted returns. By reviewing the optimized allocation and risk metrics, the financial advisor can recommend a well-diversified financial asset portfolio for their client.
An investment strategist at a crypto-focused investment firm wants to incorporate a tactical sector allocation into their portfolio. They use PRISM's Portfolio Optimization application to input target sector exposures and apply constraints on maximum and minimum asset weights. The resulting optimized portfolio aligns with their desired sector allocation and respects the imposed constraints, allowing the strategist to implement their tactical investment view.
How-to Guide
Link to the Application - Optimization
1. Portfolio and Strategy Selection
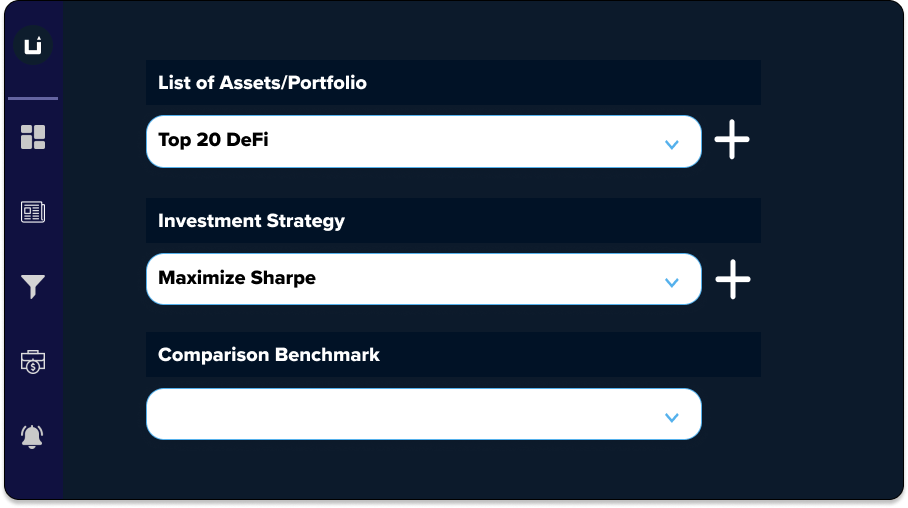
On the Portfolio Optimization application, select the portfolio you wish to optimize on the left panel.
2. Select Optimization Method or Custom Investment Strategy
Choose an optimization strategy from the available options, such as Maximize Sharpe Ratio, Maximize Return Subject to Annual Volatility, Minimize Volatility Subject to Annual Return, Minimize Conditional Value at Risk, or Minimize Volatility.
3. Parameter Selection
Customize the optimization parameters, such as sector and asset allocation, CVaR, Sharpe, volatility, beta, and liquidity score, to ensure that the optimization process aligns with your investment criteria.
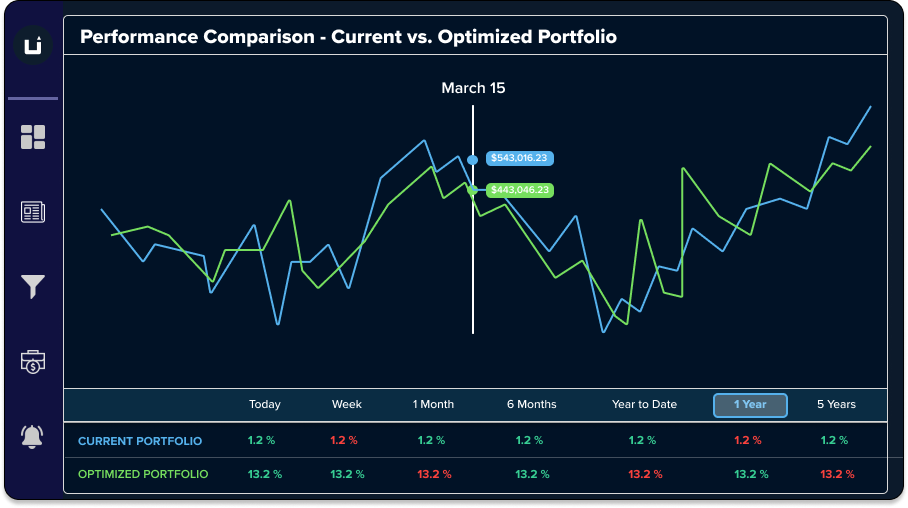
4. Compare Current Vs. Optimized Portfolio
Review the optimized asset allocation displayed in the center panel's pie chart, comparing it to your current asset allocation.
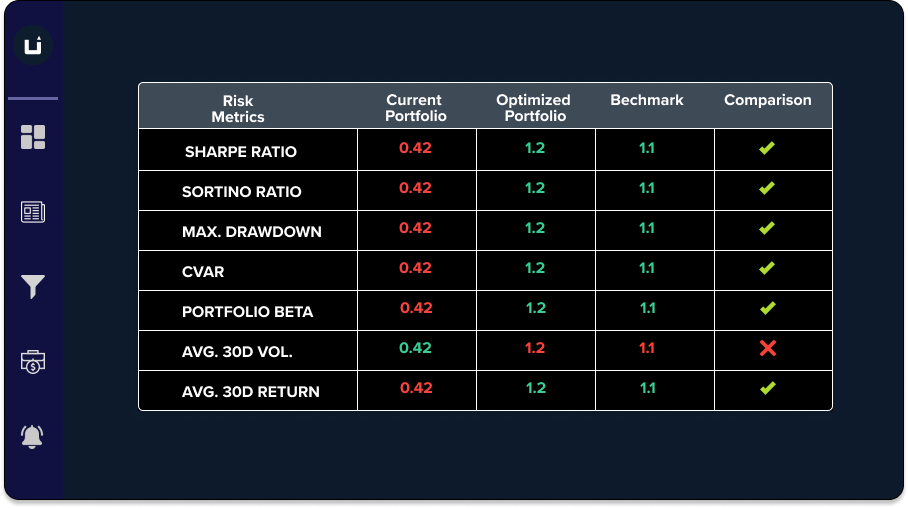
5. Compare Risk Metrics
Evaluate the key risk metrics presented in the right panel to understand the risk characteristics of your optimized portfolio.
6. Portfolio Modification
Based on the insights gained from the optimized asset allocation and risk metrics, make informed decisions about adjusting your portfolio to better align with your investment objectives and risk tolerance.